9 Python Libraries For Data Science Mastery
Thanks to its user-friendly nature and diverse range of applications, data scientists prefer Python. Its readability ensures that even those new to coding can quickly grasp it, providing an accessible entry point into the data science ecosystem.
Yet, it also offers the depth and complexity needed to perform high-level analytical and statistical functions, particularly with the help of its libraries. This guide highlights 9 essential Python libraries for data science—and every aspiring data scientist should know them.
These Python libraries serve a broad spectrum of purposes, ranging from data mining to data processing and modeling, to data visualization components.
Whether you need to sort through a raw data set, predict future trends, do exploratory data analysis, or present your findings in a visually engaging way, these Python libraries for data science have you covered.
We'll introduce each library, outlining its features, uses, and significance within data science applications and statistical analysis.
As we explore the technical depth of each library, take your time. Whether you're mining data for critical insights, statistical analysis, data manipulation, or visualizing more complex data scenarios, each Python library has something for every data enthusiast.
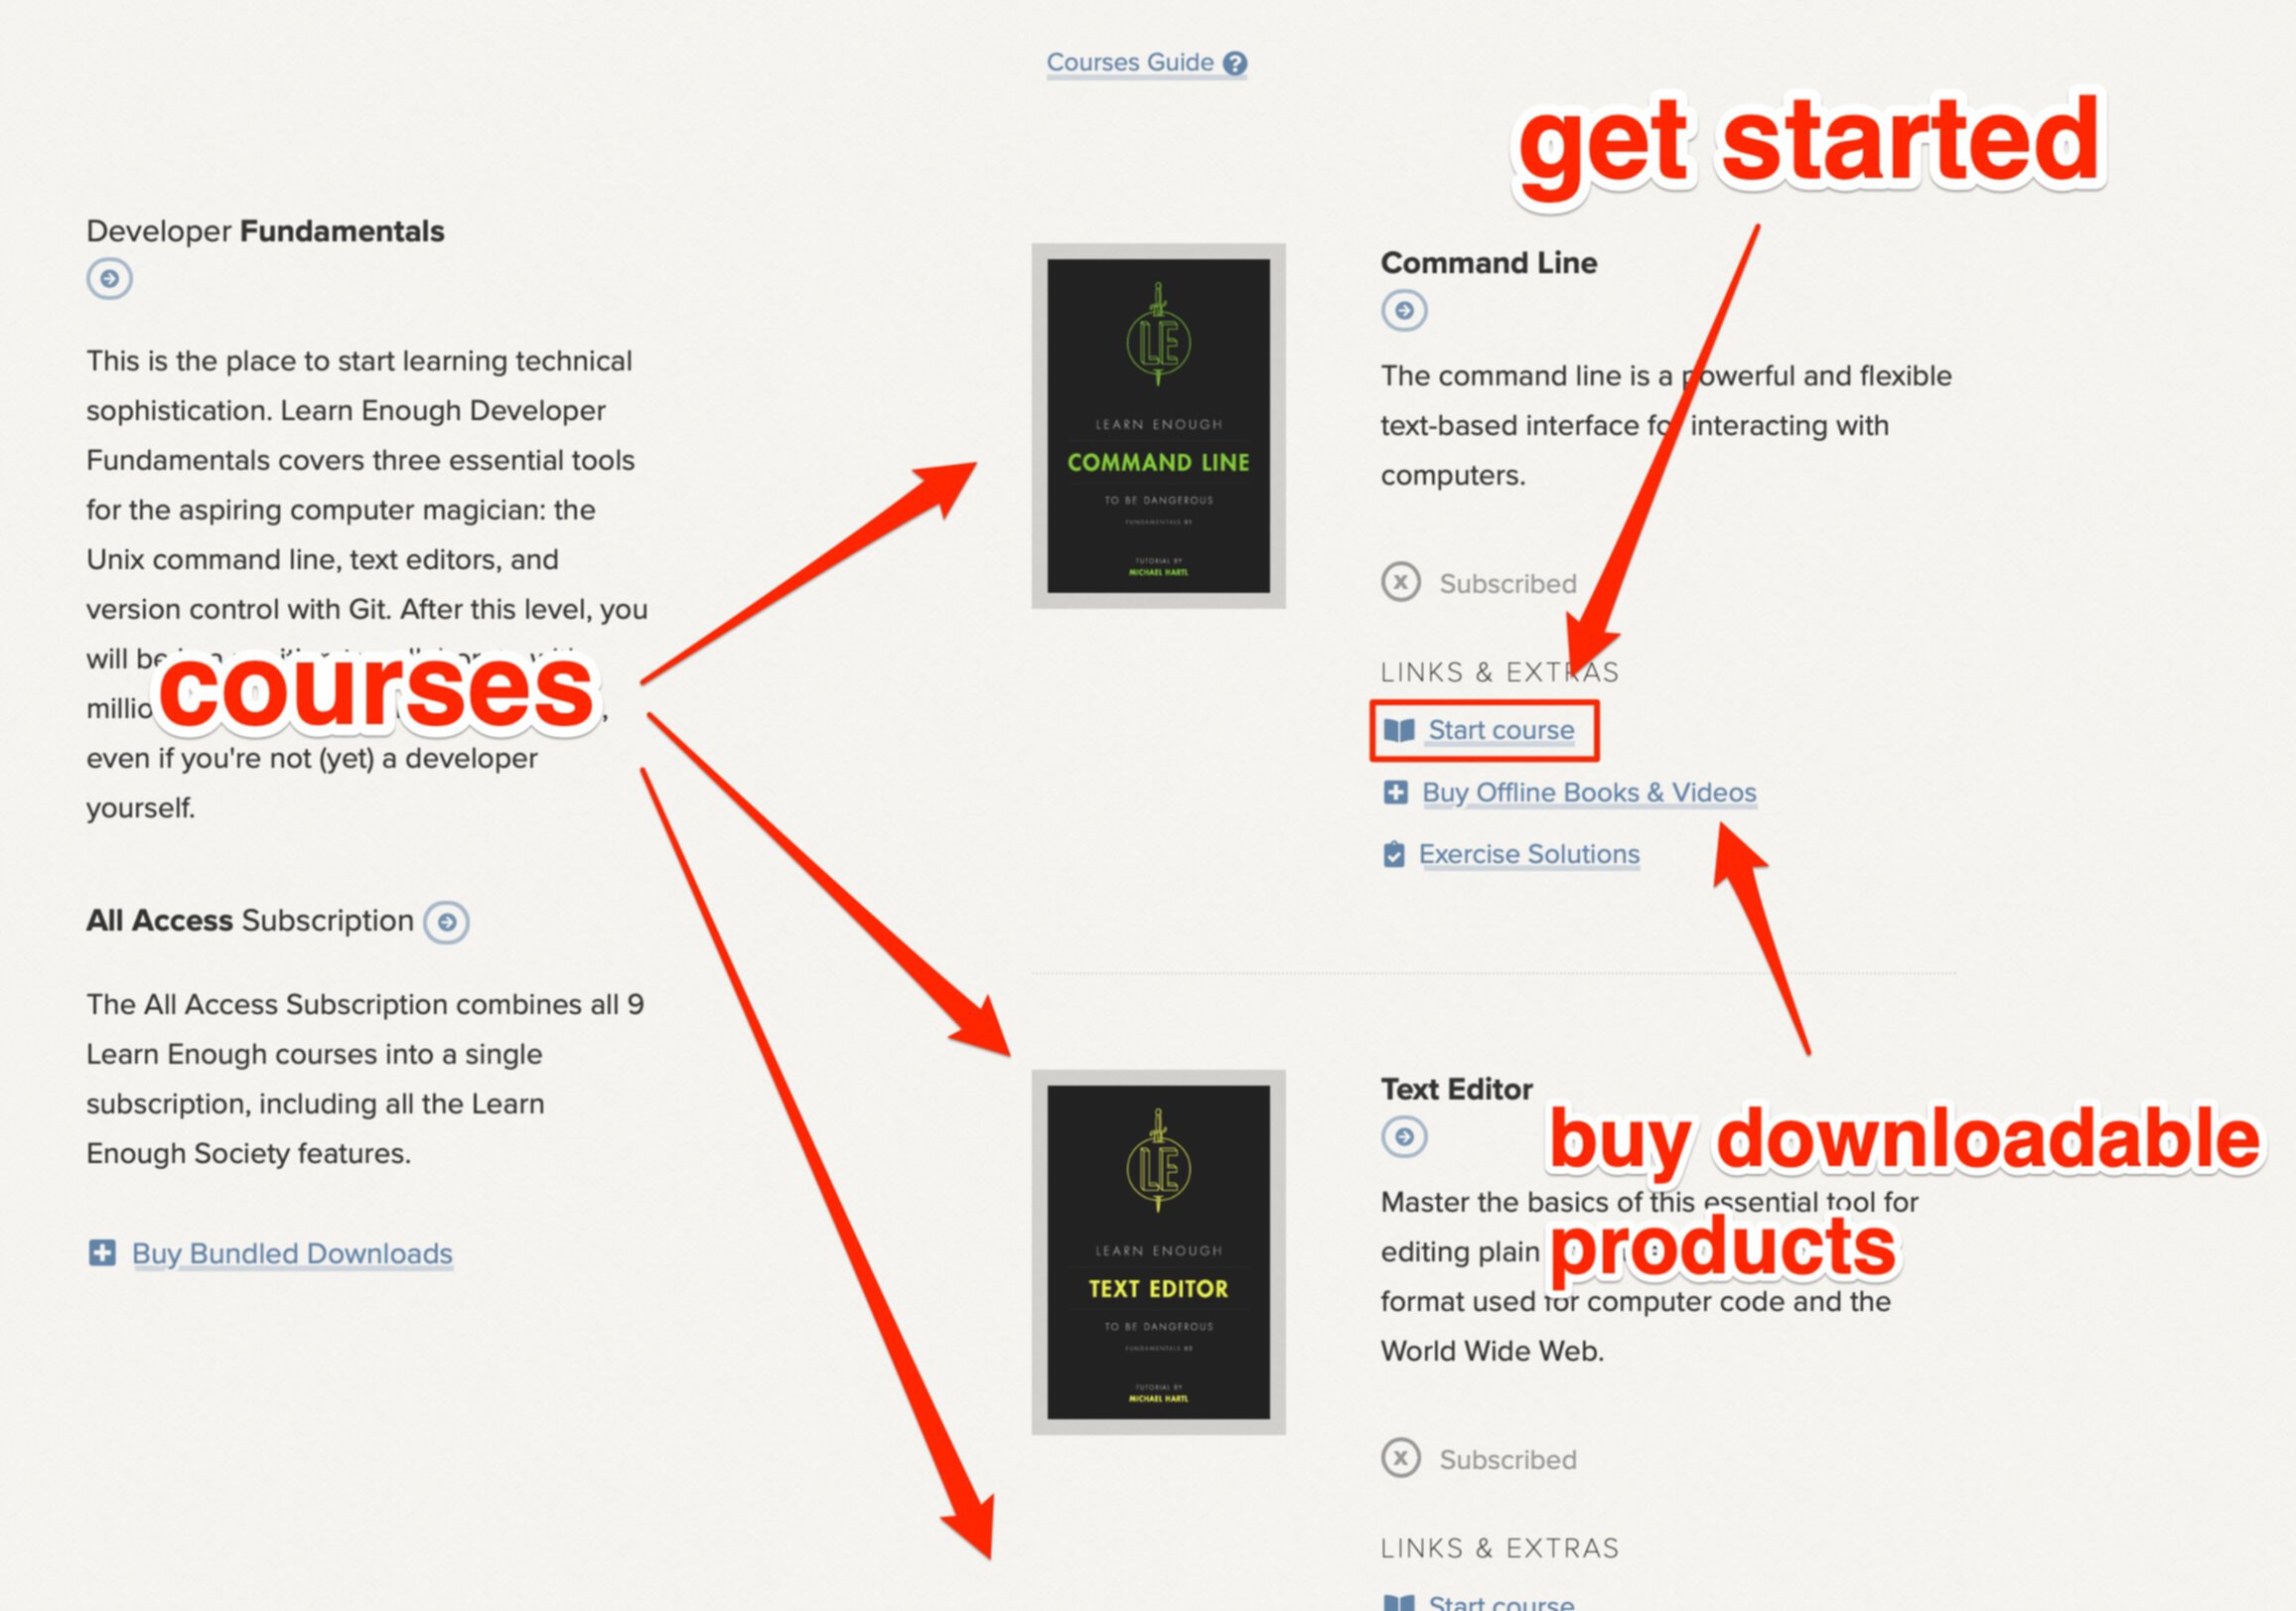
Then, if you're curious to learn more, we offer comprehensive courses Learn Enough Python To Be Dangerous to level you up.
So, let's dive into the Python libraries for data science. The world of data awaits!
Python and its significance in data science
Python is a programming language utilized in various software development areas and scientific computing. Python's simple, easy-to-learn syntax emphasizes readability, reducing program maintenance costs. Moreover, it supports modules and packages, encouraging program modularity and code reuse.
What is Python?
Python borrows elements from various other languages, resulting in a favored blend for ease of learning and versatile functionality.
Python's philosophy emphasizes code simplicity and clarity. This makes Python a top choice for beginners stepping into the coding universe.
But Python is for more than just newcomers. The language's dynamism, automatic memory management, and robust standard library make it a strong contender for everything from small scripting tasks to large-scale web applications.
Here's a simple Python program that prints the numbers from 1 to 10:
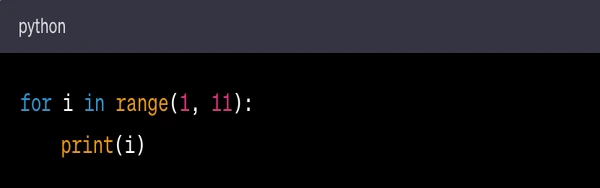
for i in range(1, 11): initiates a loop that iterates over the numbers 1 through 10. The range(1, 11) function generates a sequence of numbers from 1 up to (but not including) 11.
print(i) is the action performed on each iteration of the loop. It prints the current value of i.
When this code is run, it will print the numbers 1 through 10, each on a new line.
Why is Python preferred for data science?
Data Science professionals employ the scientific method for extracting data and then extracting insights from that data. It requires extensive expertise in statistics, computer vision, and programming language skills, to name but a few.
Before we continue, watch this insightful definition of data science from Joma Tech.
Python has emerged as a star of the data science world in recent years for several reasons:
Simplicity
Python's simplicity allows data scientists to write and test complex algorithms quickly, and its expressiveness enables the user to write fewer lines of code to accomplish tasks compared to other programming languages.
Integration
Python can integrate with almost all types of systems. This is particularly important in data science projects, where you may need to integrate your solution into a web or database server.
Also, Python can process all types of data formats. From CSV and Excel files to full-blown SQL tables, Python can read, write, and process any data.
Popularity in the industry
Many industries have adopted Python in various applications, including web development, software development, network servers, machine learning algorithms, GUI-based desktop applications, and more.
Major companies like Google, Facebook, Instagram, Spotify, Quora, Netflix, Dropbox, Reddit, and more use other Python libraries for data and in their tech stack. The wide adoption of Python in industries means more job opportunities for developers.
Python's simplicity, extensive libraries, large community, excellent integration, and wide industrial adoption make it an ideal language for many data science projects.
Whether you're a seasoned data scientist or a beginner looking to step into data science in either the project or data mining world, understanding Python will significantly enhance your capabilities and potential opportunities in the field.
Understanding libraries in Python
You'll often encounter the term "libraries" as you venture deeper into Python. They play a crucial role in Python development, especially in fields like data science, where they help you perform complex tasks relatively quickly.
But what exactly are these libraries, and why are they so significant?
What is a library in Python?
Libraries, or modules, consist of functions, methods, and types stored in a distributable file that other programmers can use. In Python, a library is a .py file that consists of already-written code.
Libraries are designed to help you to carry out many actions without writing your code from scratch. For instance, Python has a math library that houses various numerical operations, negating the need to create such functions from scratch.
This allows you to import and use these functions whenever necessary.

What is the importance of libraries in Python?
Python libraries are a boon to programmers for multiple reasons:
Pre-written code
Libraries provide pre-written and pre-tested code to perform everyday tasks, saving significant development time.
Efficiency
Python libraries are highly optimized and efficient. Experienced developers write the functions and methods within these reliable libraries, and they are highly effective at reducing program execution time.
Extensive functionality
Python boasts a diverse set of libraries that can handle a varied array of tasks.
Community support
Python's libraries have robust community support. As these and other Python libraries are open-source, they are continuously updated and improved by the community, ensuring they stay relevant and practical.
Plus, if you encounter any issues or questions, plenty of forums and resources are available to assist.
Python libraries act as building blocks for Python data visualization, providing a solid foundation for your Python data visualization or data science project.
Python libraries for data analysis
1. NumPy: a numerical Python library
NumPy is the cornerstone of numerical computing in Python.
It supports arrays (including multi-dimensional arrays) and various mathematical functions to operate on these arrays. From basic mathematical operations to random number generation, NumPy has you covered.
Here's a simple example of NumPy usage:
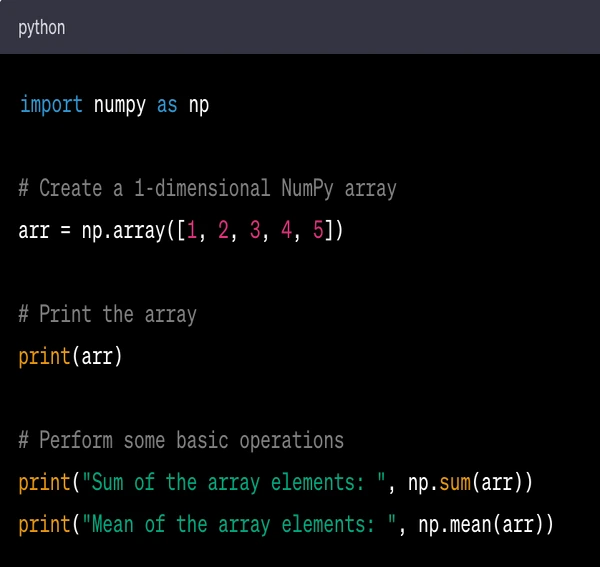
In this code:
import numpy as np imports the NumPy library and gives it the alias np for brevity.
np.array([1, 2, 3, 4, 5]) creates a 1-dimensional array (similar to a list) with the elements 1, 2, 3, 4, and 5.
np.sum(arr) calculates the sum of the elements in arr.
np.mean(arr) calculates the mean of the elements in arr.
When this code is run, it will print the array and the results of the sum and mean operations.
Features
Efficient multi-dimensional array object ndarray
Mathematical functions that operate on arrays and matrices
Tools for integrating with C/C++ and Fortran code
Fourier transform and shape manipulation
Use cases/applications
Used in scientific computing, NumPy serves as a foundational package for Python's data science stack. Consider data science tasks like numerical linear algebra, Fourier transform, or even generating random numbers—NumPy is the go-to guy.
Top careers
Data analyst: Armed with NumPy, analysts sift through heaps of data, decipher trends, and deliver insights that can shape strategic business decisions. NumPy's multidimensional arrays and a vast array of mathematical functions are critical tools in their arsenal.
Data scientist: Regarded as the rockstars of the data world, data scientists utilize libraries like NumPy to analyze, interpret complex data, and predict future patterns. The broad range of operations that NumPy supports, from simple arithmetic to sophisticated statistical distributions, is essential in their work.
For a look at how a real data analyst uses Python every day, watch the following video by Luke Barousse.
2. Pandas: a data manipulation Python library
Pandas is like the Swiss Army knife for data analysis in Python. It provides data structures and functions to collect, manipulate, and analyze structured data.
The Pandas library is a workhorse in data munging, data analysis, and signal processing activities, from importing data from various file formats to manipulating data reshaping data.
Here's a simple example of using Pandas:
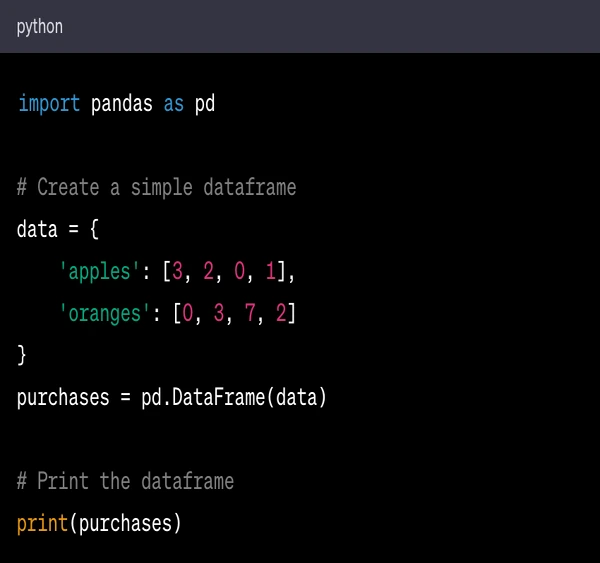
In this code:
import pandas as pd imports the pandas library and gives it the alias pd for brevity.
data = {'apples': [3, 2, 0, 1], 'oranges': [0, 3, 7, 2]} creates a Python dictionary where the keys are 'apples' and 'oranges' and the values are lists of numbers.
purchases = pd.DataFrame(data) creates a pandas DataFrame from the data dictionary. A data frame is a 2-dimensional labeled data structure with columns of potentially different types.
print(purchases) prints the DataFrame.
When this code is run, it will print a table with the data from the purchases DataFrame.
Features
Data manipulation with integrated indexing
Tools for reading and writing data
Handling missing data and merging datasets
Time-series functionality
Use cases/applications
Pandas is an ally when it comes to data wrangling, data munging, and data processing.
From data handling, renaming columns missing data, and replacing values missing data, to grouping data—Pandas does it all, and it's incredibly useful for getting your data in the correct format for streamlined data processing.
Top careers
Data analyst: Utilizing the powerful Pandas library, data analysts can effortlessly import, clean, and manipulate complex data sets. They leverage the library's robust functionalities to transform data into a digestible format, facilitating analysis and informing critical business decisions.
Data scientist: Pandas' capabilities to handle large datasets, missing data, and advanced data manipulation make it an integral tool for data scientists. They use Pandas to preprocess and explore data, which forms the foundation for their sophisticated predictive models and algorithms.
Business analyst: Business analysts rely on Pandas for insightful data exploration, cleaning, and transformation. They leverage its features to turn raw data into actionable insights, driving business strategies and optimizing operations.
3. SciPy: a scientific computation Python library
SciPy uses arrays as data structures and comes with modules for various common tasks in scientific programming, including linear algebra, integration (calculus), ordinary linear algebra, differential equation-solving linear algebra, and signal processing.
Here's a simple example of using SciPy to perform a linear algebra operation - computing the determinant of a matrix:
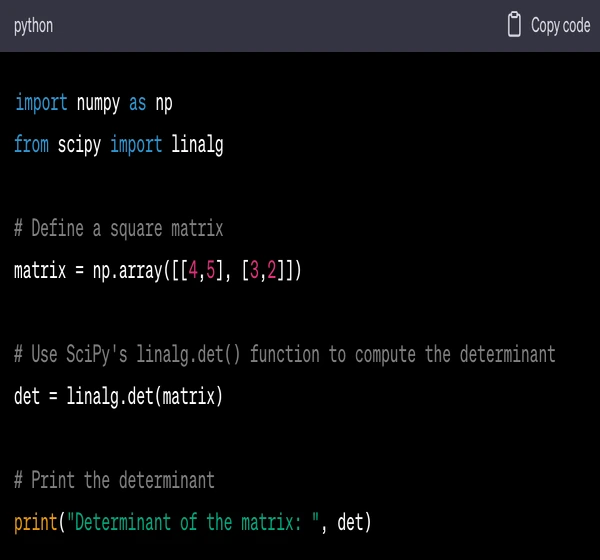
In this code:
import numpy as np imports the NumPy library and gives it the alias np for brevity.
from scipy import linalg imports the linalg module from SciPy, which contains a variety of functions for linear algebra.
matrix = np.array([[4,5], [3,2]]) creates a 2x2 NumPy array (which acts like a matrix).
det = linalg.det(matrix) uses the det function from the linalg module to compute the determinant of the matrix.
print("Determinant of the matrix: ", det) prints the computed determinant.
When this code is run, it will print the determinant of the defined matrix.
Features
Collection of algorithms for optimization, interpolation, integration, and statistics
High-level commands and classes for visualizing data
Interoperable with NumPy arrays
Use cases/applications
Used in mathematical algorithms, scientific computing, engineering, scientific and mathematical expressions, and scientific and technical computing. Whether you are integrating a curve, solving differential equations, or finding a function's roots, SciPy has got you covered.
Top careers
Data scientist: The SciPy library's rich repository of mathematical algorithms and convenient data manipulation tools make it a staple for data scientists. Its synergy with NumPy arrays and optimization, integration, and statistics capabilities help data scientists build robust predictive models, run simulations, and implement machine learning algorithms.
Research analyst: Research analysts, particularly those in scientific or technical domains, leverage SciPy's functionality in solving complex mathematical problems and analytical tasks. With its linear algebra modules, calculus operations, and robust visualization commands, SciPy provides the analytical horsepower to drive decision-making based on extensive scientific research.
Python libraries for machine learning models
4. Scikit-Learn: for ML tasks in Python
Scikit-Learn is one of the best-known machine-learning libraries for data scientists in the Python ecosystem.
Built on NumPy, SciPy, and Matplotlib, Scikit-Learn is a machine-learning library that provides tools for predictive data analysis, making it the top pick among machine-learning libraries for data scientists.
Here's a simple example of using Scikit-Learn to perform k-means clustering:
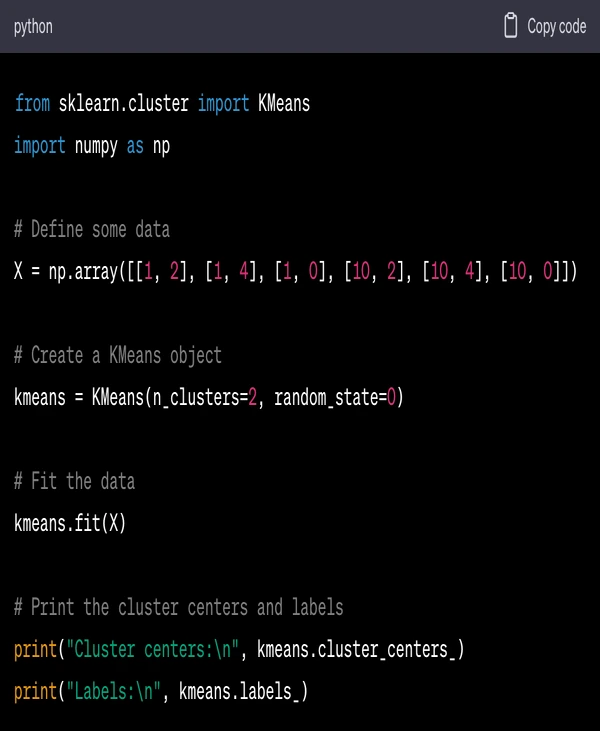
In this code:
from sklearn.cluster import KMeans imports the KMeans clustering algorithm from the Scikit-Learn library.
X = np.array([[1, 2], [1, 4], [1, 0], [10, 2], [10, 4], [10, 0]]) defines some 2-dimensional data to be clustered.
kmeans = KMeans(n_clusters=2, random_state=0) creates a KMeans object that will find 2 clusters in the data. The random_state parameter is used for the reproducibility of the results.
kmeans.fit(X) fits the KMeans model to the data.
print("Cluster centers:\n", kmeans.cluster_centers_) prints the coordinates of the cluster centers.
print("Labels:\n", kmeans.labels_) prints the labels of the data points, indicating which cluster each point belongs to.
When this code is run, it will print the coordinates of the cluster centers and the labels of the data points.
Features
Provide easy-to-use tools to mine and analyze data efficiently.
Constructed using NumPy, SciPy, and Matplotlib.
Use cases/applications
Scikit-Learn is primarily used for machine learning. Whether for preprocessing data, supervised and tested machine learning models, practitioners, unsupervised and tested machine learning models, or model selection, Scikit-Learn is your guy.
Top careers
Machine Learning engineer: Scikit-Learn is a crucial tool in an ML engineer's toolkit. With its array of tools designed for predictive data analysis and ML, it simplifies the creation, testing, and tweaking of complex machine learning algorithms. Whether data preprocessing, model selection, or implementing supervised or unsupervised learning models, a machine learning engineer can turn to Scikit-Learn for solutions.
Data scientist: Scikit-Learn's easy-to-use interface and efficient data mining capabilities make it a preferred choice for data scientists working on ML projects. Its strong integration with NumPy, SciPy, and Matplotlib further adds to its utility, making it an integral part of the data analysis pipeline, from data cleaning and exploration to modeling and visualization.
5. TensorFlow: for machine learning models in Python
TensorFlow, developed by the Google Brain Team, is a library for high-performance numerical computations. This system can work on different platforms, and mobile devices like CPUs, GPUs, and TPUs.
Here's a simple example of using TensorFlow to create and train a simple neural network on a dummy dataset:
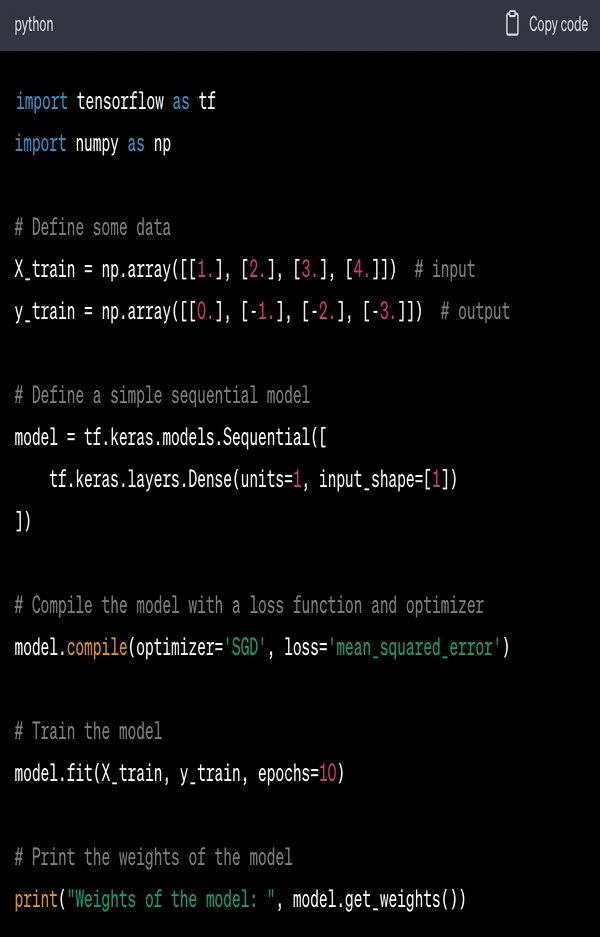
In this code:
import tensorflow as tf imports the TensorFlow library and gives it the alias tf.
X_train and y_train are the input and output training data, respectively.
model = tf.keras.models.Sequential([...]) creates a simple model with one layer.
model.compile(optimizer='SGD', loss='mean_squared_error') compiles the model with stochastic gradient descent (SGD) as the optimizer and mean squared error as the loss function.
model.fit(X_train, y_train, epochs=10) trains the model on the training data for 10 epochs (iterations over the entire dataset).
print("Weights of the model: ", model.get_weights()) prints the weights of the model after training.
When this code is run, it will train the model on the input data and then print the weights of the trained model.
Features
Deep learning and neural networks are well-supported.
High scalability of computation across machines and large datasets
Supports CPUs, GPUs, and even Google's custom-developed ASICs, known as TPUs
Includes TensorBoard, a visualization tool
Use cases/applications
TensorFlow is used for both basic ML algorithms and production research due to its flexibility, and it has become a standard library for deep learning algorithms.
Top careers
Machine Learning Engineer: MLEngineers use TensorFlow to design, build, and train complex machine learning models. This involves using TensorFlow's suite of tools for defining model architectures, training them on large datasets, and optimizing their performance. They also leverage TensorBoard, TensorFlow's visualization toolkit, for monitoring the training process and debugging models.
AI Specialist: They leverage TensorFlow's ability to perform high-speed numerical computations, which is essential for tasks like image and speech recognition, natural language processing, and other AI applications. TensorFlow's scalability and versatility make it a robust tool for AI Specialists.
6. Keras: a deep-learning Python library
Keras is a neural network library that operates on top of TensorFlow, providing a high-level interface.
It is designed to be easy to use, modular, and flexible, making it a perfect tool for developers exploring deep and train ML models in Python.
Here's a simple example of using Keras to create and train a simple neural network on a dummy dataset:
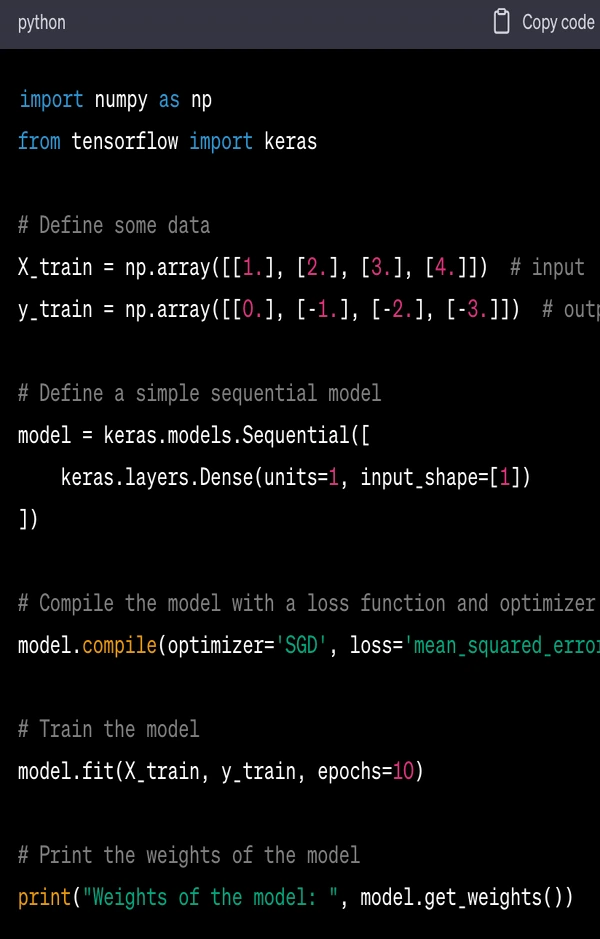
In this code:
import numpy as np and from tensorflow import keras import the necessary libraries. Keras is now part of TensorFlow and should be imported from there.
X_train and y_train are the input and output training data, respectively.
model = keras.models.Sequential([...]) creates a simple model with one layer.
model.compile(optimizer='SGD', loss='mean_squared_error') compiles the model with stochastic gradient descent (SGD) as the optimizer and mean squared error as the loss function.
model.fit(X_train, y_train, epochs=10) trains the model on the training data for 10 epochs (iterations over the entire dataset).
print("Weights of the model: ", model.get_weights()) prints the weights of the model after training.
When this code is run, it will train the model on the input data and then print the weights of the trained model.
Features
User-friendly as it's simple, consistent, and minimizes the number of user actions needed for everyday use cases
Highly modular and composable, allowing you to mix and match different models or layers
Easy to extend and adapt, whether you want to add a custom layer or an extra cost function
Use cases/applications
Keras is often used for small datasets due to its ease of use and the fact that it works on top of TensorFlow, making it quite versatile. It's great for rapid prototyping and getting a working model up and running.
Top careers
Machine Learning engineer: TensorFlow is a go-to for Machine Learning Engineers. Its ability to perform high-performance numerical computations makes it ideal for training and deploying ML models. With support for multiple platforms, from CPUs and GPUs to Google's custom TPUs, TensorFlow allows for efficient model development and testing across various infrastructures. The additional advantage of TensorBoard, a powerful visualization tool, aids in understanding and interpreting machine learning models.
AI specialist: For AI Specialists, TensorFlow's flexibility and broad support for deep learning and neural networks make it indispensable. Its scalability for handling large datasets and conducting computations across different machines is pivotal in AI applications, from automated driving to healthcare. Its capability to support research-grade and production-grade applications equally well positions it as a favored tool for AI development and deployment.
Python libraries for data visualization
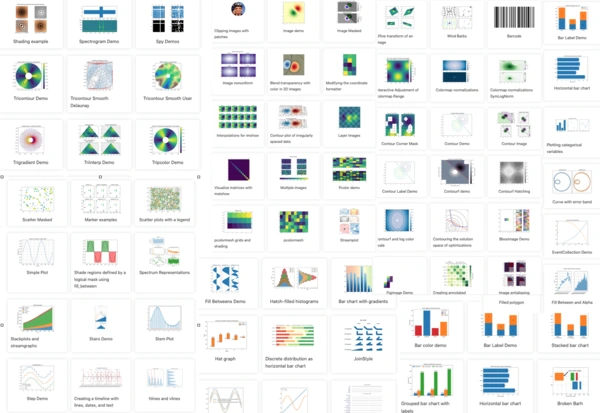
7. Matplotlib: for plotting and visualization
Matplotlib is a plotting library for Python. It provides an object-oriented API for embedding plots into applications using general-purpose GUI toolkits like Tkinter, wxPython, Qt, or GTK.
Here's a simple example of using Matplotlib to create a line plot:
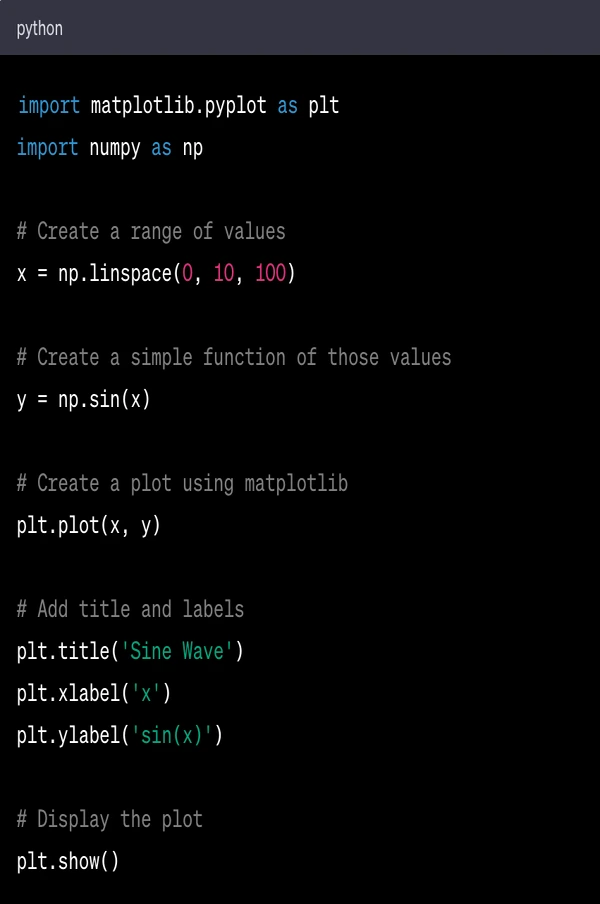
In this code:
import matplotlib.pyplot as plt imports the pyplot module from Matplotlib, which provides a MATLAB-like plotting framework.
import numpy as np imports the NumPy library, which provides support for arrays and many mathematical functions.
x = np.linspace(0, 10, 100) creates an array of 100 numbers evenly spaced between 0 and 10.
y = np.sin(x) applies the sine function to each number in the x array, resulting in a new array y.
plt.plot(x, y) creates a line plot of y versus x.
plt.title('Sine Wave'), plt.xlabel('x'), and plt.ylabel('sin(x)') set the title and labels for the plot.
plt.show() displays the plot.
When this code is run, it will display a line plot of the sine function from 0 to 10.
Features
Provides a MATLAB-like interface
Support for custom labels and texts
Excellent control of every element in a figure, including figure size and DPI
High-quality output in many formats, including PNG, PDF, SVG, EPS, and PGF
Use cases/applications
Matplotlib is used for creating static, animated, and interactive web-based data visualizations in Python.
Top careers
Data analyst: Matplotlib is a favorite tool among data analysts because it can generate high-quality static plots in various formats. From histograms to scatter plots, Matplotlib offers a variety of ways to represent data, allowing analysts to draw meaningful insights from data.
Data visualization engineer: For data visualization engineers, Matplotlib's fine control over every element in a figure, custom label support, and high-quality outputs make it an ideal choice. The ability to create interactive web-based data visualizations using Matplotlib enhances data interaction.
Data scientist: Data scientists often use Matplotlib for exploratory data analysis. Whether it's identifying trends, patterns, or relationships between variables, Matplotlib aids in conveying complex data insights in a visually intuitive manner.
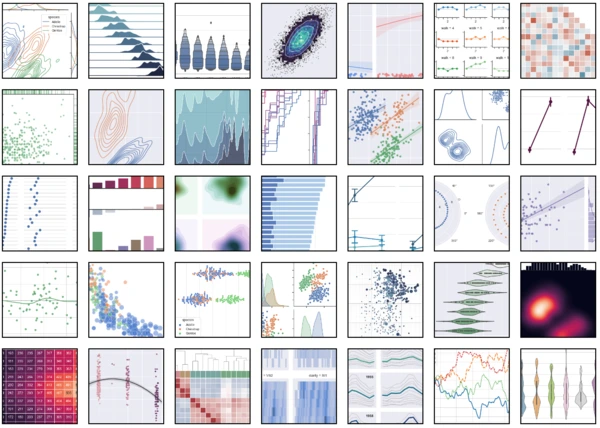
8. Seaborn: for statistical and data visualization tasks
The Seaborn library allows users to create statistical graphics in Python. Built over Matplotlib, Seaborn provides a high-level interface for drawing attractive and informative statistical graphics.
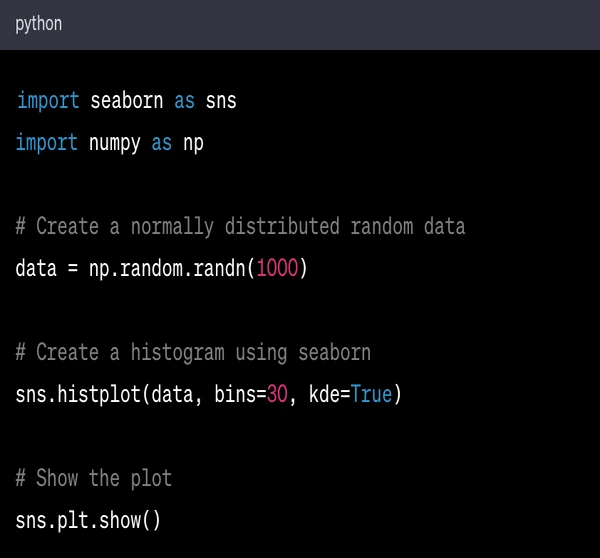
Here's a simple example of using Seaborn to create a histogram:
In this code:
import seaborn as sns imports the Seaborn library and gives it the alias sns.
import numpy as np imports the NumPy library.
data = np.random.and (1000) generates 1000 normally distributed random numbers.
sns.histplot(data, bins=30, kde=True) creates a histogram of the data with 30 bins, and also plots the kernel density estimate (KDE), which is a smoothed version of the histogram.
sns.plt.show() displays the plot.
When this code is run, it will display a histogram of the normally distributed random data, with the KDE plotted as a smooth curve.
Features
Built-in themes for styling Matplotlib graphics
Visualizing univariate and bivariate data
Fitting in and visualizing linear regression models
Functions to visualize matrices of data and covariance data
Use cases/applications
Seaborn visualizes data transformations using statistical models and data structures like heat maps, pie charts, time series, and violin plots.
Top careers
Data analyst: Data analysts commonly use Seaborn due to its high-level interface and comprehensive methods for comparing multiple variables simultaneously. It's beneficial for its capabilities in visualizing complex statistical data analysis, making it easier to interpret data and make data-driven decisions.
Data visualization engineer: Seaborn is an excellent tool for data visualization Engineers. Its ability to create visually appealing and informative statistical graphics, along with built-in themes for styling, is ideal for creating comprehensive visuals that effectively communicate data findings.
Data scientist: For data scientists, Seaborn's functionality extends beyond data visualization. It's used for visualizing intricate patterns and correlations in data. Using functions like heatmaps and violin plots, they can visualize and understand their data's underlying distributions and relationships, which is essential to building accurate predictive models.
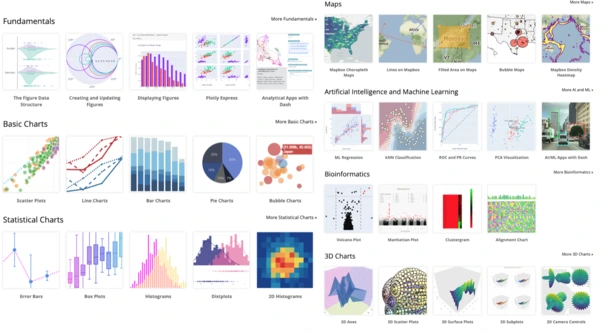
9. Plotly: for creating interactive plots
Plotly is a powerful tool that enables you to retrieve structured data to produce interactive plots for use in dashboards or websites. These plots can be saved as HTML files or static images, providing flexible options for creating data visualizations.
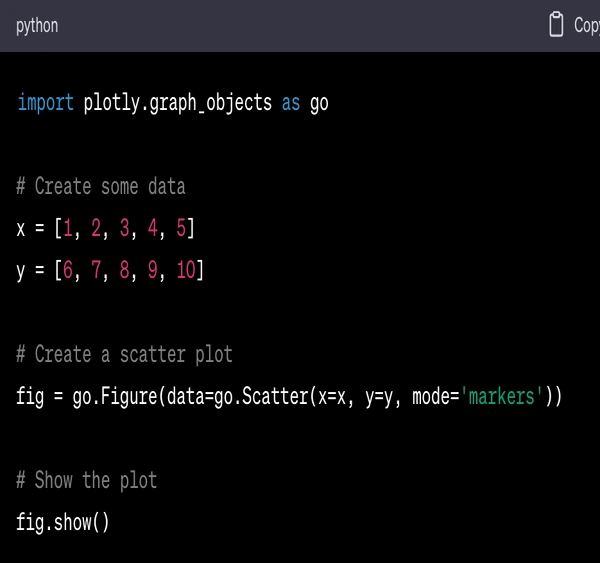
Here's a simple example of using Plotly to create a scatter plot:
In this code:
import plotly.graph_objects as go imports the graph_objects module from the Plotly library, which includes functions for creating a wide variety of interactive plots.
x and y are lists of numbers that will be used as the x and y coordinates of the points in the scatter plot.
fig = go.Figure(data=go.Scatter(x=x, y=y, mode='markers')) creates a scatter plot with markers (not lines) at the points specified by x and y.
fig.show() displays the plot.
When this code is run, it will display an interactive scatter plot. You can zoom in, zoom out, pan, and hover over the points to see their coordinates.
Features
Interactive plots can zoom, pan, hover, and see data values.
Wide variety of charts with high-level API
High-quality interactive scientific plots
3D plotting capabilities
Use cases/applications
Plotly is used in interactive data visualization, like bar charts, user-interface bar charts, data frames bar charts, online dashboards, and more.
Top careers
Data analyst: Data analysts often employ Plotly for its interactive features that provide dynamic insights into the data. It facilitates comprehensive data analysis, allowing analysts to drill down to granular details using the graphs' hover, zoom, and pan features.
Data visualization engineer: For data visualization engineers, the versatility of Plotly is a significant draw. The ability to create various charts, including scientific plots and 3D graphs, and the flexibility to export them as static images or interactive HTML files are valuable for effectively and effectively communicating data findings.
Data scientist: Data scientists use Plotly not just for its data visualization features but also for its compatibility with web applications. They leverage Plotly to build interactive dashboards, a powerful tool for sharing analyses and models with technical and non-technical stakeholders. Its high-level API allows for easier integration of data visualizations in applications, which is vital in creating accessible data products.

In conclusion
And there you have it, a rundown of 15 Python libraries critical to mastering data science.
Python libraries for data science are vast and incredibly useful in each stage of the data science pipeline, from data analysis and deploying machine learning models to data visualization.
Learning these libraries will make you proficient in data science and open doors to exciting career paths. So why wait?
Dig into these top fifteen Python libraries for data science now, and explore our Learn Enough Python courses to guide you through your Python data visualization library and science journey.
Master all the names on this Python library list, then master data science!
There you have it, folks! Now you are ready to conquer the world of data science with Python and its powerful libraries.
Frequently asked questions
What are some Python libraries for data science?
Several Python libraries are commonly used in data science. Some of the most popular ones include TensorFlow, NumPy, SciPy, Pandas, Matplotlib, Keras, Scikit-Learn, PyTorch, Scrapy, and BeautifulSoup.
Why are Python libraries important for data science?
Python libraries are important for data science because they provide pre-written code, functions, and routines that can be used to perform complex tasks. This allows data scientists to focus on the analysis and interpretation of data, rather than on the coding of basic functions.
What is the use of the Pandas library in data science?
Pandas is a software library that provides data structures and functions needed for manipulating and analyzing data. It is arguably the most used package by data scientists all over the world due to its ease of use and powerful data manipulation capabilities.
What is the use of the NumPy library in data science?
NumPy, short for Numerical Python, is a library for numerical calculations and scientific computations. It provides numerous features such as support for arrays and matrices, mathematical functions to operate on these arrays, and functionalities for operations such as sorting, statistics, and random number generation.
What are some Python libraries for data visualization?
Matplotlib and Seaborn are two popular Python libraries for data visualization. Matplotlib provides a wide range of tools for creating static, animated, and interactive plots in Python. Seaborn is based on Matplotlib and provides a high-level interface for creating attractive statistical graphics.
What are the most important Python libraries for data analysis?
The essential Python libraries for processing and analyzing data for data science projects are NumPy, Pandas, and SciPy. These can be defined as follows:
NumPy provides powerful numerical operations on large, multi-dimensional arrays and matrices, often used in scientific computations.
Pandas is handy for handling and analyzing datasets in DataFrame format.
SciPy builds on NumPy and provides more advanced functions useful in scientific research and data analysis, including statistics and mathematical computations.
Which Python libraries are essential for machine learning?
The top Python libraries for machine learning include Scikit-Learn, TensorFlow, and Keras.
Scikit-Learn offers straightforward and practical tools for analyzing and modeling data.
TensorFlow, developed by Google Brain, is extensively used for creating deep learning models. It allows for designing, building, and training models such as neural networks.
Keras, working as a wrapper for TensorFlow, offers a more straightforward way to create neural networks. It simplifies building complex machine-learning models, making it ideal for beginners.
What are the best Python libraries for data visualization?
Python offers a fantastic array of libraries for data visualization. We can mention Matplotlib, Seaborn, and Plotly to name the main libraries. These are the go-to Python libraries for creating stunning and informative data visualizations.
Each data visualization library has its strengths and ideal use cases, making them essential tools in any data scientist's arsenal.

All Access Subscription
Get free access to all 10 Learn Enough courses (including the Ruby on Rails Tutorial) for 7 days!
Free 7 Day trial details
We require a credit card for security purposes, but it will not be charged during the trial period. After 7 days, you will be enrolled automatically in the monthly All Access subscription.
BUT you can cancel any time and still get the rest of the 7 days for free!
All Learn Enough tutorials come with a 60-day 100% money-back guarantee.